Toolbox
A toolbox for academia and non-academia people to get in touch with various methods for uncertainty quantification in machine learning.
This project is maintained by werywjw
import sklearn.datasets
import matplotlib.pyplot as plt
from sklearn.neighbors import KNeighborsClassifier
from sklearn.model_selection import train_test_split
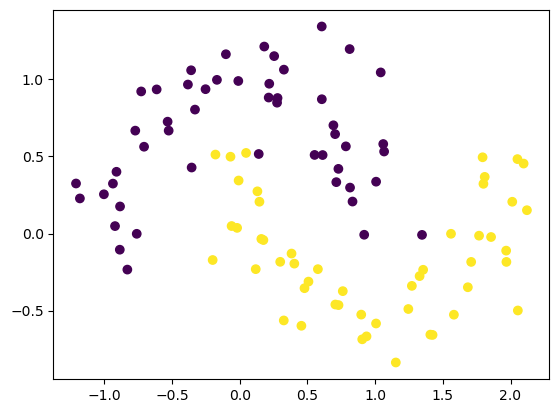
We first need to gather the data
For this we will load the moon data and apply an KNN Algorithm
X,y = sklearn.datasets.make_moons(n_samples=100,noise=0.2,random_state=0)
plt.scatter(x=X[:,0],y=X[:,1],c=y)
plt.show()
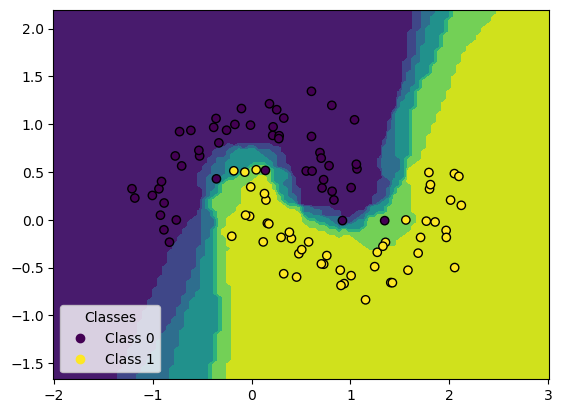
Now we apply KNN to the data and visualize the prediction regions
X_train, X_test, y_train, y_test = train_test_split(X,y,random_state=0)
model = KNeighborsClassifier(n_neighbors=5)
model.fit(X_train,y_train)
KNeighborsClassifier()In a Jupyter environment, please rerun this cell to show the HTML representation or trust the notebook.
On GitHub, the HTML representation is unable to render, please try loading this page with nbviewer.org.
KNeighborsClassifier()
from sklearn.inspection import DecisionBoundaryDisplay
disp = DecisionBoundaryDisplay.from_estimator(estimator=model, X=X_test)
scatter = disp.ax_.scatter(X[:, 0], X[:, 1], c=y, edgecolors="k")
disp.ax_.legend(
        scatter.legend_elements()[0],
        ["Class 0", "Class 1"],
        loc="lower left",
        title="Classes",
)
plt.show()